Google Ads: How to Understand Your Ecommerce Performance
Managing an ecommerce Google Ads account is rarely about making more changes. It is about setting up your workspace so you can understand what is actually happening before making a decision.
Google’s automated bidding is designed to work toward the targets you set, so changing a tROAS or tCPA target in response to a temporary performance dip can reduce delivery and conversion volume before you understand what actually caused the change. With Google continuing to put more emphasis on automated bidding, having the right diagnostic data available before making those changes is becoming even more important.
The challenge is that the default Google Ads interface is built for general utility. It places top-funnel metrics like impressions and click-through rates right beside bottom-funnel purchase values, showing you that top-line performance moved without giving any context as to why. If a drop in ROAS is driven by traffic shifting toward lower-ticket items or standard attribution delays, adjusting your bidding target addresses the wrong problem.
The following post focuses on four areas of Google Ads management: understanding the overall trend, calculating the metrics behind it, building a consistent reporting view, and diagnosing common performance changes.
Once these are in place, you can make decisions based on what is actually happening in the account rather than reacting to a single metric before you change a bid or budget.
1. Adjust the Performance Summary Chart
Before reviewing individual campaign rows, adjust the summary graph at the top of the interface so it gives you a clearer picture of advertising performance.
By default, Google Ads frequently shows Clicks vs. Cost, which provides limited insight into commercial performance.
- Review Revenue Against Spend: Change the chart metrics to Conversion Value vs. Cost (or Conversion Value / Cost). This provides an immediate visual read on whether revenue is scaling in proportion to ad spend.
- Switch from Daily to Weekly View: Change the graph time increment from Daily to Weekly. Daily graphs can exaggerate normal fluctuations, particularly around weekends, promotions, and changes in traffic volume. Weekly view filters out day-to-day noise to highlight the macro trend.
2. Add Custom Formula Columns
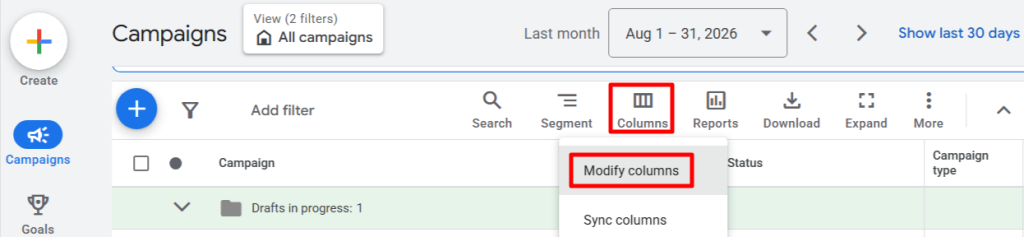
Calculating key commercial metrics does not require external tools or manual spreadsheet exports. You can build custom formula columns directly inside the Google Ads interface (Columns > Modify columns > + Custom column):

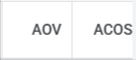
Average Order Value (AOV): Identifies whether a change in revenue is caused by lower order volume or smaller cart sizes.
- Formula: Conversion Value / Conversions
Advertising Cost of Sales (ACOS): Translates Google’s ROAS ratio into a clear percentage of revenue. If your gross margin on a product line is 35%, an ACOS above 35% would consume more than the gross margin before other costs are considered.
- Formula: Cost / Conversion Value (Set format to Percentage %)
3. Configure the Core Ecommerce Saved Column View
Once your custom calculations are configured, assemble a dedicated column set and save it as your default workspace. Group your columns around five operational areas:
- Delivery & Spend: Cost, Impressions, Clicks, and Avg. CPC
- Tracks budget delivery and click cost changes.

- Top-Line Returns: Conv. Value, Conv. Value / Cost (ROAS), Conversions, and Conv. Rate
- Evaluates gross revenue and transaction volume against performance targets.

- Unit Economics (Custom Columns): AOV, and ACOS
- Helps evaluate basket size and advertising cost relative to revenue.
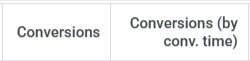
- Attribution Timing: Conversions (by conv. time), and Conv. Value (by conv. time)
- Separates normal conversion latency from genuine performance downturns.
- Search Visibility & Headroom: Search IS, Search Lost IS (Budget), and Search Lost IS (Rank)
- Pinpoints whether missed impression volume stems from budget caps or uncompetitive Ad Rank. These metrics are most useful for Search campaigns. For Performance Max, rely on channel and product-level reporting alongside Auction Insights, rather than trying to force Search-specific impression share metrics.

Pro-Tip: Where margin data is available, consider incorporating product-level margin into your analysis. Revenue and ROAS measure sales efficiency, but they don’t tell you how much profit is left after product and operating costs.
4. The ROAS Diagnostic Framework
When account efficiency shifts, review these four common scenarios before modifying automated bidding targets or budget.
Before diagnosing a change, compare the same period with an appropriate historical period.
Scenario A: ROAS Drops, but Conversion Rate and CPC Remain Stable
- Metric to inspect: Average Order Value (AOV).
- Possible cause: Spend has shifted into lower-ticket products, lower-margin products, or clearance inventory.
- Action: In Report Editor, pull a table by feed attributes (Item ID, Product type, or Custom label) to see if low-ticket items are absorbing your budget, then isolate them into dedicated campaigns or asset groups with stricter ROAS targets.
Scenario B: ROAS Drops and Conversion Rate Declines, but AOV and CPC Are Flat
- Metric to inspect: Landing pages and website tracking.
- Possible cause: Broken destination URLs, tracking interruptions, checkout friction, or a recent change to the conversion setup.
- Action: Test live product page URLs on mobile and desktop, check for recent website or checkout changes, verify conversion tracking, and complete a test purchase.
Scenario C: ROAS Drops, Conversion Rate Is Stable, but CPC Increases
- Metric to inspect: Search Lost IS (Rank) where applicable and Auction Insights.
- Possible cause: Increased competitor auction pressure or changes in auction dynamics.
- Action: Review Auction Insights where available, check whether competitors or pricing have changed, and review traffic and product-level performance before changing bids or budgets.
Scenario D: ROAS Appears Low Over the Most Recent 3 to 7 Days
- Metric to inspect: Conversion Value (by conv. time) versus standard Conversion Value.
- Possible cause: Standard conversion latency and consideration lag.
- Action: Keep monitoring the campaign. If customer purchase cycles average 3 to 7 days, recent data may need more time for delayed attribution to become available before performance can be judged fairly.
Pro-Tip: New vs. returning customers. If your analytics or ecommerce platform provides reliable data, check whether revenue is coming primarily from new or returning customers. ROAS alone doesn’t tell you whether you’re actually acquiring new customers.
Moving from Reactive Adjustments to Systematic Management
Effective Google Ads management isn’t about making a change every time a metric moves.
It’s about understanding what changed, why it changed, and whether it actually requires action.
A drop in ROAS could be caused by lower AOV, higher CPCs, weaker conversion rates, a change in product mix, tracking issues, or simply incomplete recent data. Each situation calls for a different response.
That’s why your Google Ads interface matters. The right columns and reports won’t optimize the account for you, but they can make it much easier to diagnose problems before changing bids, budgets, or campaign structure.
Don’t optimize the number you see first. Find out what caused it.