Google Shopping Campaign Trends 2022
For those new to the Google Shopping game we thought it would be helpful to provide some context on how we got to where we are now with Google Shopping. This post primarily compares a large anonymous dataset from 2020 to 2021. Giving us the ability to accurately highlight key trends for 2022.
Table of Contents
- A Brief History of Google Shopping
- Shopping Campaign Trends 2020 – 21 Intro
- All Shopping Campaigns Combined
- Smart vs. Standard Shopping
- Commonalities Between Different Industries
- Ecom vs DTC
- Where We’re Heading: Goodbye Smart Shopping, Hello Performance Max
A Brief History of Google Shopping
2002-2012
Google has been listing relevant products for user search queries since 2002. They acquired these listings through two sources:
1. its own crawls
2. product feeds supplied by vendors through Google Merchant Center. These listings at the time were also free. The screen shot below shows the SERP for “digital camera” before the change.

Then in 2012 we saw the introduction of bidding for product listings. This required a Google Adwords account as well as Google Merchant Center. User searches look a little something like this when they searched for ‘digital cameras’:

A Failed Marketplace
Then, in 2018/19, Google was on a mission to get users on to Google Shopping. From the outside it seemed as though they had ambitions to make a marketplace play. By the end of 2020 it had attracted 8,000 sellers and even had an app. However in comparison to Amazon’s 1.7 million, this wasn’t even a drop in the bucket.
The Pivot
New sellers were not attracted to minimal advertiser visibility and sales volumes. Google had to make a change, so they shifted their focus from sellers to products. This created a much lower barrier to entry for sellers looking to utilize Google’s reach. In return, Google got to aggregate significantly more inventory, which in turn drove increased traffic. With this, Google’s advertising business became highly attractive.
Here are some of the latest mobile friendly views of Google Shopping taken from the beginning of 2020:


Shopping Campaign Trends 2020-21 Intro
At Take Some Risk we’ve seen first hand just how quickly Google’s pivot has fueled Shopping Ads growth. At this point, most if not all of our clients now take advantage of both Manual and Smart Shopping campaigns. Within this article we are going to take a deeper dive into the YoY numbers from 2020 to 2021 to highlight: how this landscape has shifted, where things lie currently, and what to expect in the future.
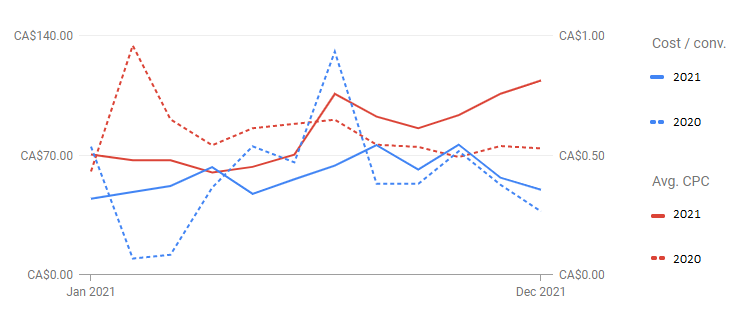
Change in CPC/CPA YoY Data
The data being used in this analysis has been taken from a blended mix of 21 DTC & Ecommerce retail brands. It accounts for 32 Accounts (When Parent/Child accounts are combined) with products ranging from children’s toys to phone cases. Demonstrating both the volume of data & variety of products being sold, this sample size puts us in a unique position to be able to comment with a degree of confidence about the YoY shifts we have seen.
All Shopping Campaigns Combined
So without further ado here are the key stats for all Shopping campaigns combined.
Year Over Year Changes In CPC
Monthly Data:

Weekly Data:
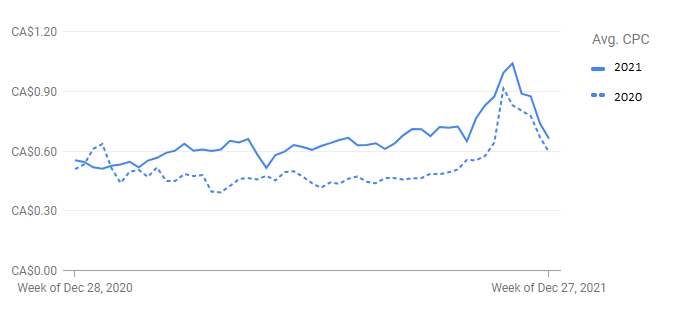
CPC: $0.55 to $0.67 = +$0.12 increase (+22%) – A CPC cost increase of this size shows the YoY increase in competition from additional brands uploading their inventory to Google’s Merchant Center and paying to advertise through Google Shopping campaigns. Ad spend in 2020 was also negatively affected by the pandemic.
Year Over Year Changes In CPA
Monthly Data:

Weekly Data:
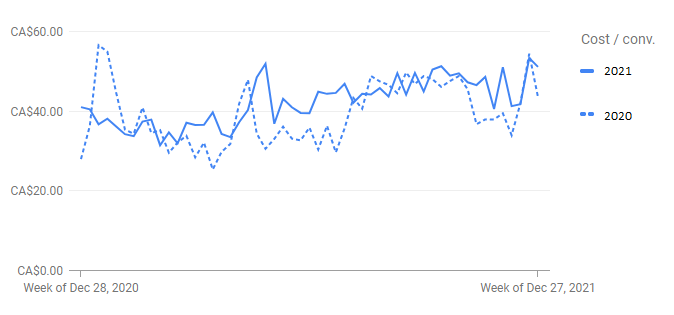
CPA: $39.28 to $42.36 = $3.08 increase (+7.83%) – Overall the CPA didn’t experience as much of an increase, but it is interesting to see which times of the year 2021 was ahead of 2020.
💡 Despite the increase to CPC costs, we were able to limit a relatively small increase in the CPA for our clients. How did we achieve this? There are a myriad of different ways to attain success through your Google Shopping campaigns many of which are outlined for free on our blog.
Search Impression Share vs Cost
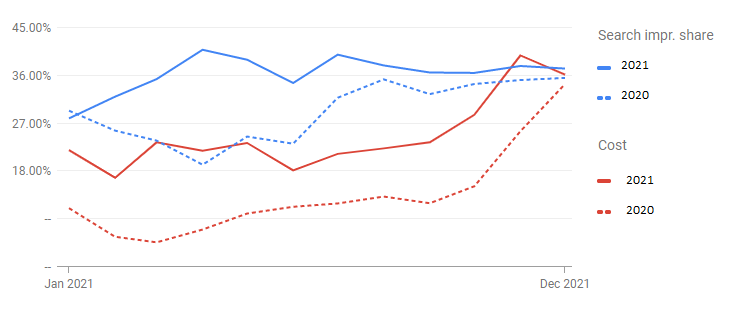
Search Impression Share: 29.43% to 36.28% = 23.29% increase – As the world continued to suffer from the pandemic and people shopped online, brands increased their advertising spend in 2021. This resulted in an increased impression share in the market, clearly outlined above as you see costs and search impression share significantly higher.
YoY Changes In Conversion Rate
Monthly Data:

Weekly Data:

Conversion Rate: 1.35% to 1.53% = 13.04% increase. Despite the increase in competition on Shopping, we saw an increase in conversion rate YoY. A testament to both the quality of work at TSR, and the advances in Google’s marketing technology.
YoY Changes In CTR

CTR: 0.85% to 0.80% = 5% decrease. While we increased our market share, CTR saw a decrease due to the increased competition. With more competitors joining the marketplace and an increase in their bids, inevitably CTR got impacted.
Smart vs. Standard Shopping
YoY performance
| Metric | Smart | Standard | Difference |
|---|---|---|---|
| Sample Size | 213 Campaigns | 265 Campaigns | 52 = +20% Total Standard Shopping Campaigns |
| CPC | $0.68 (+27.77%) | $0.64 (+13.33%) | $0.04 = +6.25% Smart Shopping CPC increase |
| CPA | $45.62 (+9.52%) | $37.98 (-1.31%) | $7.64 = +20% cost difference for Smart Shopping |
Smart Shopping vs. Standard Findings
Given that Smart Shopping has been available to use since 2018 it is telling that we still utilized more standard shopping from 2020/2021. Initially the lack of control and poor performance was a big deterrent, up until Google improved the overall performance of Smart Shopping did it make a more viable opportunity to utilize.
Due to the scale and additional placements available for Smart Shopping (Google Search, Display, YouTube, and Gmail) understandably CPC costs for campaigns are higher than those of Standard (Google Search). They also experienced higher growth in terms of cost YoY too, highlighting the rate Smart Shopping grew in terms of both our adoption and competition from other brands.
Smart shopping campaigns had a higher increase in CPC, but the CPA for Standard Shopping is less compared to Smart Shopping. Smart Shopping drives more volume of sales/revenue, whereas Standard Shopping campaigns on average are more efficient.
Commonalities Between Different Industries
The following segments are categorized by their different GA Industry categories. Some cases are broken out into custom sub groups to ensure data is evenly spread.
Shopping > Home
- CPC: $0.81 -0.30% YoY decrease
- CPA: $33.30 +1.11% YoY increase

Even though the total numbers stayed relatively the same YoY, it is interesting to see how people’s purchase behaviors were potentially affected by the pandemic. With the CPC & CPA spiking during times of the year when cases were high, and people were forced to be at home more often.
Shopping > Apparel
- CPC: $0.64 +15.76% YoY increase
- CPA: $58.64 +36.73% YoY increase
Apparel is always a highly competitive game, and the volatility of the data shown above highlights that. The increases to both CPC and the significant increase to CPA really shows just how tough it has been in terms of competition for advertising. As people were forced to shop online, many ecommerce brands saw significant growth in sales YoY.
Hobbies & Leisure
- CPC: $0.72 +32.33% YoY increase
- CPA: $33.57 +6.44% YoY increase

With a 32% CPC increase, Hobbies & Leisure is another big growth story, fueled in part by the lack of international travel. Products such as mountain bikes, and outdoor gear were in high demand as consumers looked for domestic travel alternatives, and started new hobbies they could do safely during the pandemic.
Ecom vs DTC
DTC
- CPC: $0.98 -8.10% YoY decrease
- CPA: $51.43 -42.24% YoY decrease

Ecom
- CPC: $0.66 +22.44% YoY increase
- CPA: $30.83 +4.74% YoY increase

Where We’re Heading: Goodbye Smart Shopping, Hello Performance Max
Despite the significant performance increases we’ve seen and continue to see from Smart Shopping campaigns Google continues to change and evolve its offerings. Performance Max seems to be the logical next step. It utilizes all of Google Ads inventory combined, further utilizing automation and the potential to leverage all this with advanced attribution models.
Performance Max 2022 Auto Upgrade
By Q3 of 2022 Google has announced that all Smart Shopping campaigns are being upgraded to Performance Max.

As an agency we have been taking a phased approach to testing Performance Max campaigns, starting with smaller campaigns to ensure performance isn’t significantly disrupted, then scaling to larger campaigns with an eye on the auto-upgrade in Q3. Interested in testing Performance Max? Check out our complete guide here to give you a rundown of everything you need to know about how to run a successful campaign.
So this time next year we won’t be talking about Smart Shopping vs. Standard. We’ll be comparing Shopping vs. Performance Max, or perhaps we’ll be comparing Performance Max with another new product launch from Google.
Take Some Risk
💡 Our team has a wealth of knowledge running Google Shopping campaigns, interested to see some of the work we’ve done? Check out our work here.